



The eye-catching figures – produced by OddsMatrix – uses data from Capology to calcute how much every team spent on player wages during the last campaign.
The stats – if they are to be believed – also provide an interesting insight into which clubs got value for money and which sides badly underachieved.
It suggests Forest spent £58,006,000 in wages last season compared to Man City’s whopping £224,733,600.
Here we look at how the Premier League table would have looked based on wages.
Join the debate over on our social media channels.

9. Newcastle United
£95,175,600 Actual position: 5th Photo: Getty Images
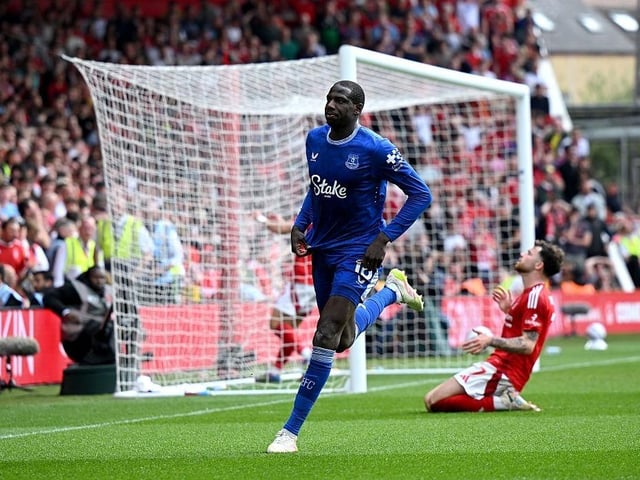
10. Everton
£73,788,000 Actual position: 13th Photo: Getty Images
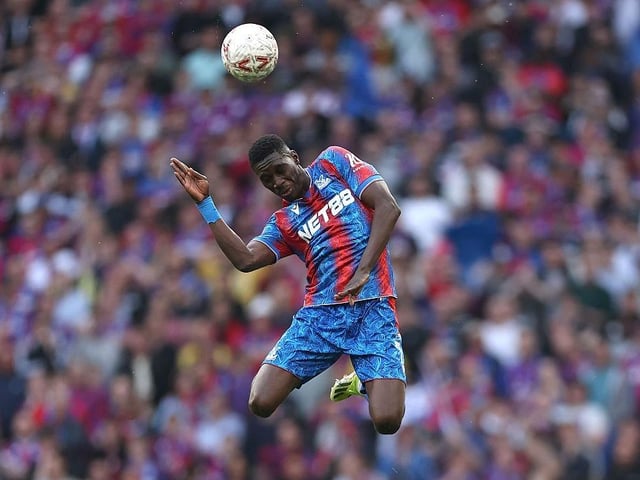
11. Crystal Palace
£73,684,000 Actual position: 12th Photo: Getty Images
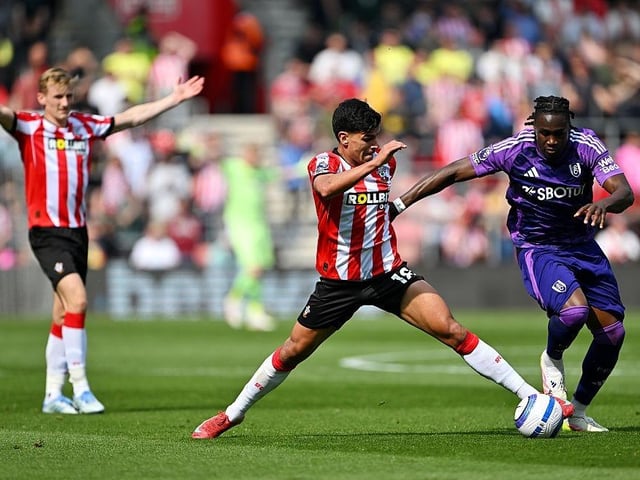
12. Fulham
£71,526,000 Actual position: 11th Photo: Getty Images