
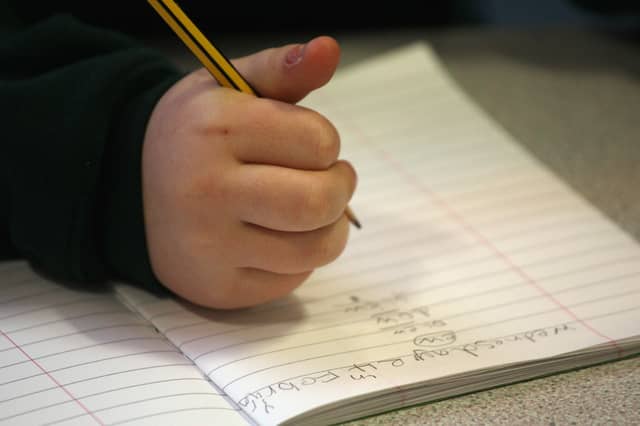


Official data has revealed the 15 worst-performing primary schools in Nottinghamshire based on SAT scores.
Formally known as Standard Assessment Tests, children in year 6 and year 2 across the country sit their SATs each May.
These tests serve as a measure of a child's attainment against government-set standards in English and maths.
This data is then used to create a league table where parents can gauge educational progress.
Using the data available on the Department for Education’s website, we have identified the state primary schools in Nottinghamshire with the lowest percentage of students who met the expected standard in reading, writing and maths.
We also included each schools average reading and maths scores, which can be a maximum of 120 points.
Special schools have not been included in the list.
Here are the 20 worst-performing state primary schools in Nottinghamshire based on SAT scores for 2023/24:
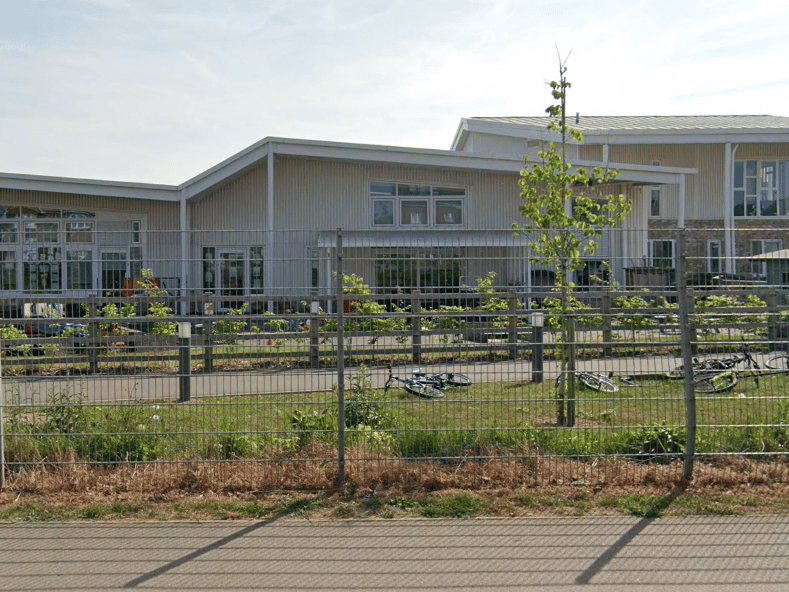
9. Christ Church C of E Primary School Type of school
27% of pupils met expected standard for reading, writing and maths. The average score for reading was 99 and 96 for maths | Google Photo: Google
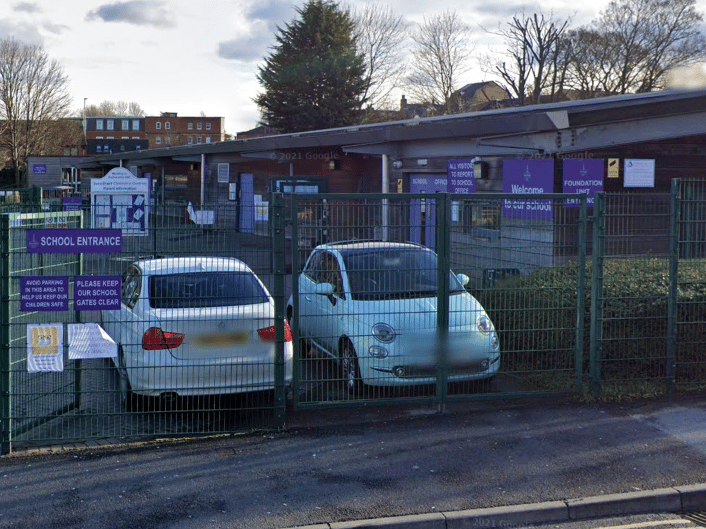
10. Mount CofE Primary School
27% of pupils met expected standard for reading, writing and maths. The average score for reading was 97 and 96 for maths | Google Photo: Google
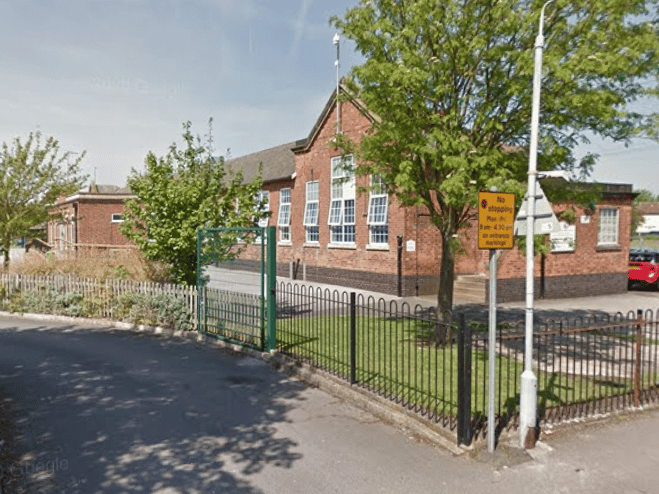
11. Haggonfields Primary and Nursery School
31% of pupils met expected standard for reading, writing and maths. The average score for reading was 102 and 97 for maths | Google Photo: Google
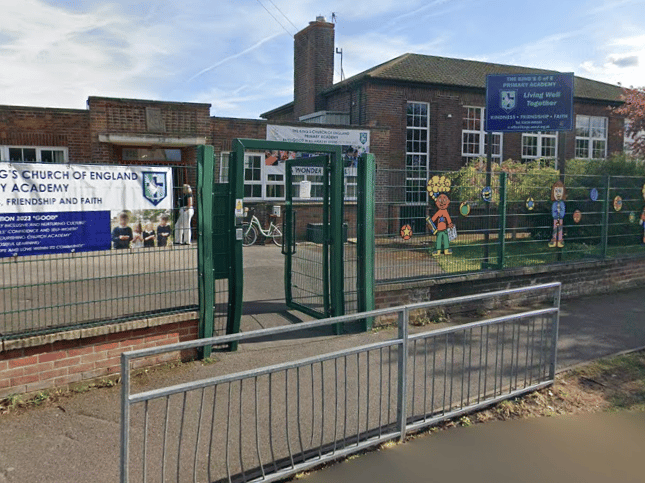
12. The King's Church of England Primary Academy
32% of pupils met expected standard for reading, writing and maths. The average score for reading was 101 and 98 for maths | Google Photo: Google