


The performance of primary school children is assessed in several ways, from spoken examinations to written tests.
This information from schools across the UK is then published on the Department for Education’s website, allowing parents to check which schools are yielding the best results.
A range of different primary school performance metrics are available to the public, including the percentage of pupils meeting the expected standard and average scores in maths and reading.
During key stage 2, primary school pupils are assessed by sitting a maths test, which is known as the maths ‘scaled score’.
The average scaled score is the mean scaled score of all pupils awarded a scaled score. It only includes pupils who took the test and achieved a scaled score.
The expected standard is a score of 100 or more, while the higher standard is 110 or more.
With the autumn term now in full swing, we’ve taken a look at 10 of the best-performing state primary school in Nottingham for maths grades.
The latest set of data covers key stage 2 performance in 2024.
Discover the 10 best-performing schools below:

5. Dunkirk Primary and Nursery School
Average maths score: 108 | Google Photo: Google
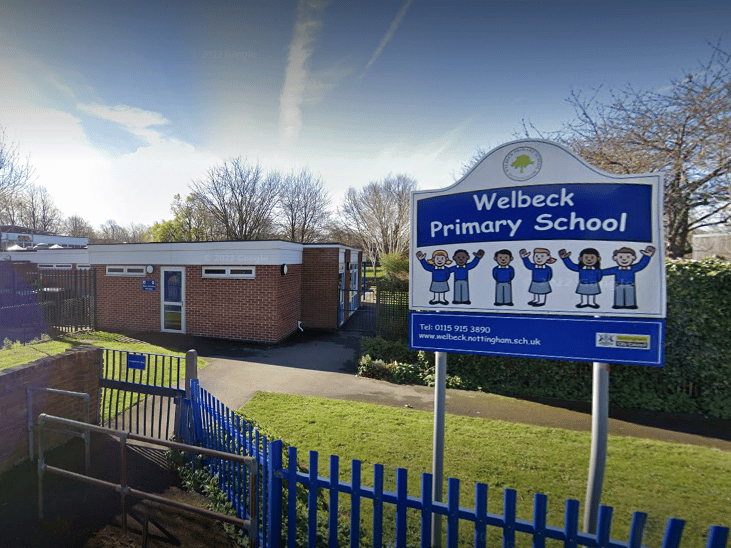
6. Welbeck Primary School
Average maths score: 108 | Google Photo: Google

7. St Margaret Clitherow Catholic Primary School
Average maths score: 108 | Google Photo: Google
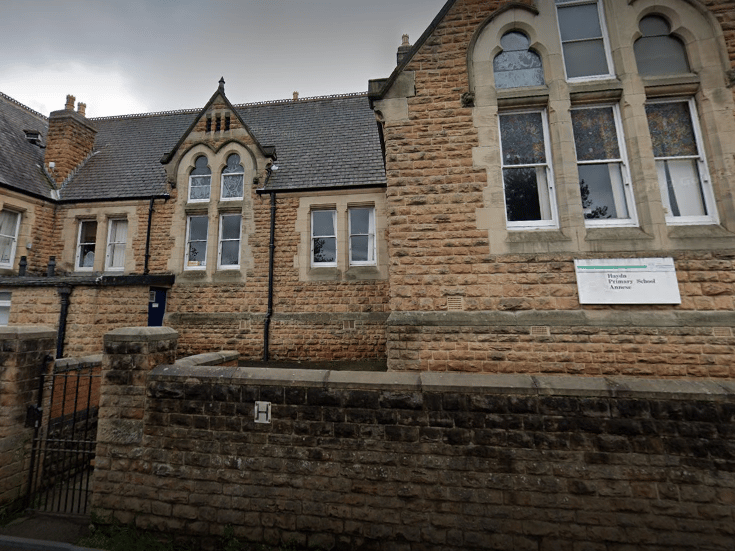
8. Haydn Primary School
Average maths score: 107 | Google Photo: Google