

Official government data has revealed the best and worst Nottingham primary schools based on the latest maths scores.
All primary schools in the city are ranked on several criteria to assess performance, including the percentage of pupils meeting the expected standard, as well as average scores in reading and maths.
With regards to maths scores, the Department for Education says: “This score shows how well pupils performed in the key stage 2 maths test.
“This score is known as the maths ‘scaled score’. The average scaled score is the mean scaled score of all pupils awarded a scaled score.
“It only includes pupils who took the test and achieved a scaled score. The expected standard is a score of 100 or more. The higher standard is 110 or more.”
The latest set of data covers key stage 2 pupils in 2024.
We’ve picked out the five best and five worst-performing Nottingham primary schools for maths scores.
Scroll down for the full gallery, with the five best-performing followed by the five worst-performing:
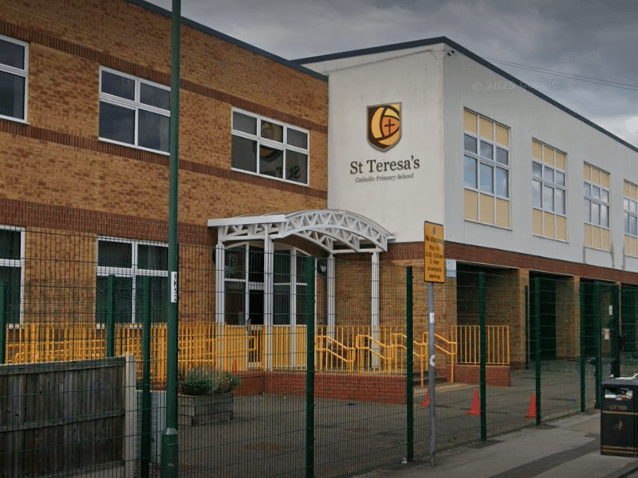
1. St Teresa's Catholic Primary School
Average score in maths: 109 | Google Photo: Google
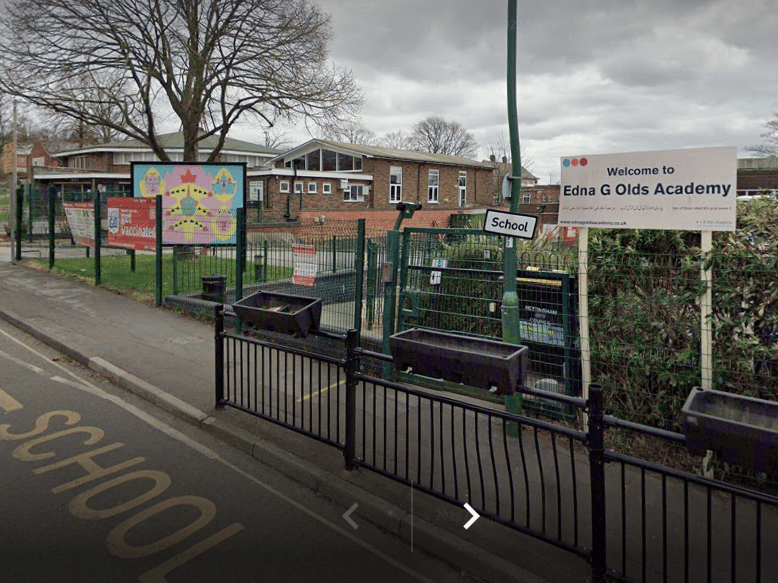
2. Edna G Olds Academy
Average maths score: 109 | Google Photo: Google
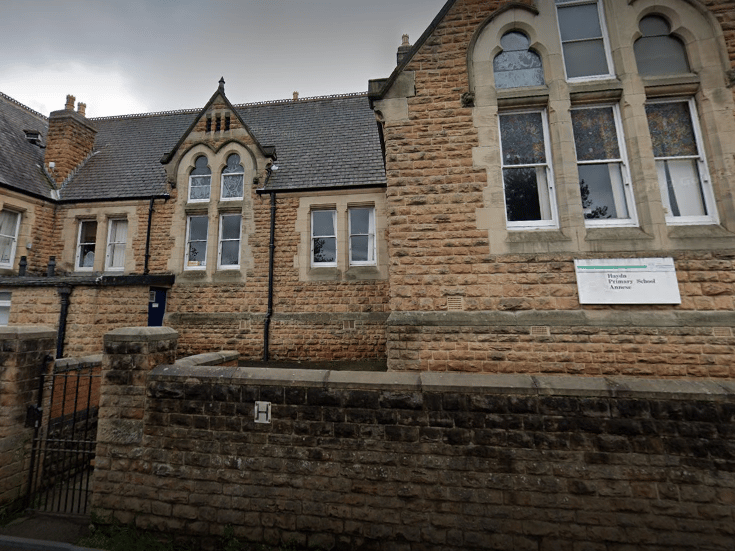
3. Haydn Primary School
Average maths score: 107 | Google Photo: Google
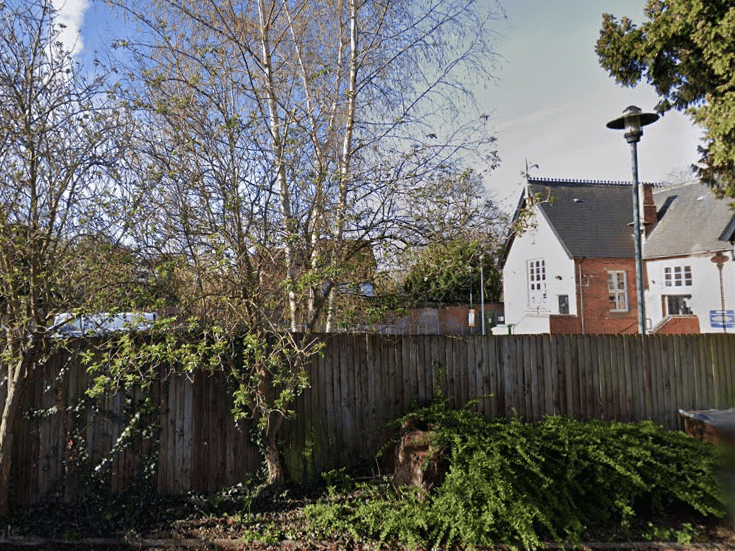
4. South Wilford Primary School
Average maths score: 107 | Google Photo: Google